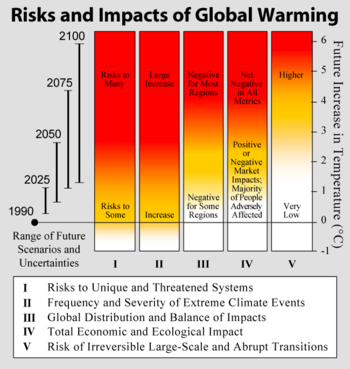
When most think of global warming, they think of science but, global warming relates to math too. With global warming comes many statistics which include ratio, time, percentage, graphs, amounts, and probability. Some examples are graphs (such as the one above) that show the impact of global warming and how it is becoming greater throughout the years. Also, there were many percentages such as those saying how much of an increase of decrease there was in elements such as water and ice. Ratio is involved to provide a comparison between the amounts of certain elements in time and time was involved to show how over time, the effects of global warming have become greater. Probability was used to give an idea of how bad global warming can become if not stopped. Lastly, amounts were used to represent how much of certain elements are being effected by global warming and how much may be left in time. To conclude, math is a very big part of global warming.
